 Principles
 Every asset type, market and share has its own unique pattern. However, when the market displays a congruence of technical triggers using some simple indicators and correlations our experience shows 90% of the reason a share or stock goes up or down is because the global, country and sector is going up or down.
We find investors and traders spend most of their time analysing a stock but very little time looking at the global, country and sector outlook. An example would be looking to buy BHP Billiton with very little consideration for the movement of higher grade copper and nickel as well as the direction of the Shanghai index.
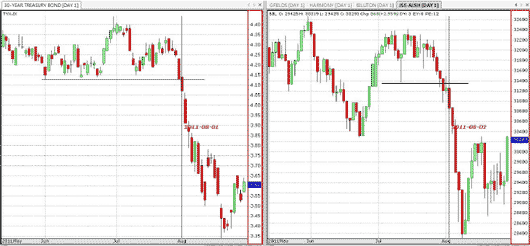
Some traders do this intrinsically by reading the market’s momentum as it rallies and jumping on the band wagon. There are some simple steps to get the formula in a big picture perspective by considering some examples. Consider the following look at the correlation between the 30 year Treasury bond yield and the JSE All Share index charts below:
Click image to enlarge
Notice how using some simple technical patterns such as the break of the support on the US 30 Year Treasury bond yield chart and compare it to the break below the previous support on the JSE ALSH index within the same time period provided major congruence.
We use the US 30 Year Treasury bond yield chart as a correlation to global indices such as the SP500, Dow Jones & even the JSE ALSH. In other words, when we find that there is a significant technical pattern that triggers on the 30 yr bond chart it confirms the same momentum to follow on the global indices with very high correlation.
The last week of July 2011 indicated a change in direction for the 30 year bond yield chart as it broke the support at 4.12%. Similarly the JSE ALSH index also broke its support at 31400 as well.
General technical analysis and chart pattern recognition is required in making investment decisions. With the example above we discussed the break of support on both charts being significant.
For additional correlation consider the congruence below where all of the major global indices triggered the same break in support levels and moved lower:

Click image to enlarge
Various charts also supported double top patterns which also triggered simultaneously. The simple use of the correlation with the 30 year Treasury bond yield chart confirmed the downside technically.
One of the steps we consider before making any investment decisions in the equity asset class is the analysis of the 30 year Treasury bond yield chart. The link between equity assets and bond yields is fairly significant and highly correlated. As bond yields move lower equity indices generally follow.
In order to gauge the direction and momentum within the country look at the break down of the JSE All Share Index with a 45% - 55% asset allocation favouring financial and industrial sectors compared to mining sectors as slightly heavier weighting.
Looking at our earlier example regarding BHP Billiton as a buy, it falls within the JSE RESI sector and base metals subsector of the JSE All Share. Here we can consider a set of indicators formulated to give investors and traders a much higher probability that a position results in returns on investment.
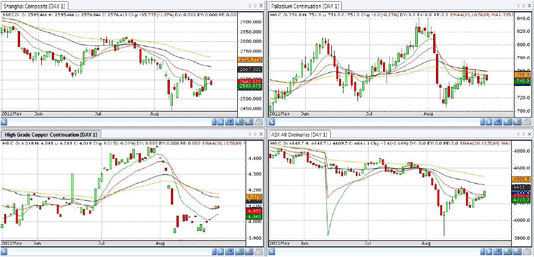
Just like the global equity indices move in tandem with the bond yield chart, we watch the Shanghai along with the ASX and other contributing indicators such as the Baltic Dry Index, the US Dollar and metals & minerals prices.
Click image to enlarge
Here above we can see the synchronised move down by various charts showing a major sell off on the 1st August 2011. The Shanghai index however provided a slight lead in the event. Again a double top pattern formation is visible and assists in the early detection of the chart’s likely direction. Confirmation from the higher grade copper, palladium and ASX index charts also played out.
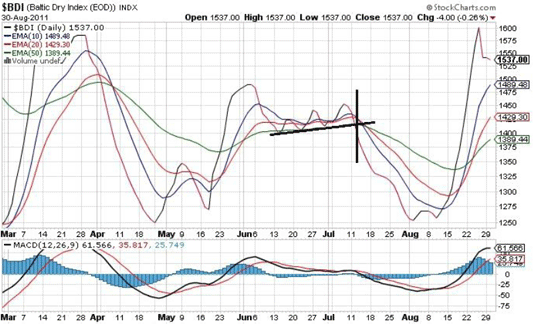
The Baltic Dry index below also provided a slight lead on the downward movement of the resource heavy market indices and sectors. Similarly the US Dollar moved stronger versus the Euro contributing to lower commodity prices.
Relative Performance
Before making decisions about which asset class to invest in consider their respective cycles. In conjunction with analysing markets, country and sector before making investment decisions & portfolio allocation it is also vital to consider the performance of said asset classes to each other.
To discern which assets are outperforming others make use of the Price Relative or Relative Strength indicators to compare the price movement over time of two charts. It is paramount to compare sectors within the JSE over a weekly and daily timeframe in order to gauge the best performing and worst performing sectors. The first consideration is comparing the FINDI to the RESI to decide which of the major weighting of the All Share index should be considered as the best performing. The outcome of which should determine the major focus of your investment decision going forward.
For instance, over the last few months the FINDI has outperformed the RESI index considerably. It could then be prescribed that only long or buy positions should be taken within the FINDI and only shorts or abstinence within the RESI.

Click image to enlarge
It was without doubt that the short position or abstaining from the RESI was confirmed by the Price Relative comparison and that longs or buys were better placed within the FINDI. The difference is over 6000 points between the major weighting sectors drawn simply down the FINDI and RESI.
One thing to consider when using the Price Relative is that when markets are falling it will reflect only that one or other is not falling by the same amount. Similarly, when markets are all heading up it will indicate the sector lagging the bullish rally or those moving sideways.
At the very least if you were invested in the FINDI on average you would have experienced much less loss of equity value within the same time as whether you would have been invested in the RESI in general. Once determining the disposition of the major weighting of the two sectors we can break them into subsectors and repeat the process.
With a global outlook and using the various confirmation indicators discussed above combined with Price Relative weighting, together they provide the roadmap to making high probability investment and trading decisions.
By waiting for technical global events to develop traders can take advantage of the momentum that drives the markets, the sectors and stocks. In that order. Focus on taking shorts in the worst performing sectors as the markets move lower and focus on longs or buys as the markets move higher with the best performing sectors.
Brought to you by Wealth Skills. Contact Warrick Selzer at warrick@wealthskills.co.za or visit the website www.wealthskills.co.za now.


