Equity market recoveries after crashes
By Christo Luüs

 |
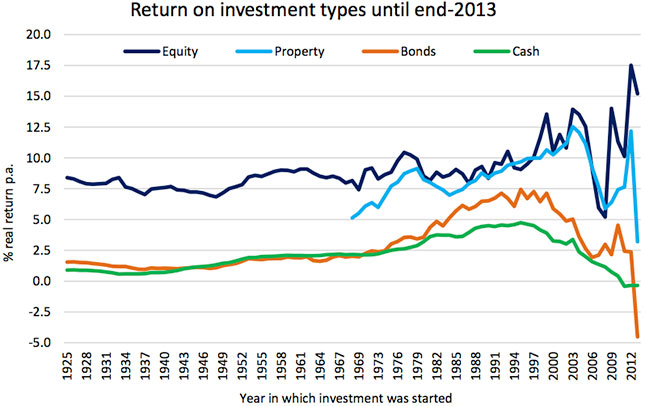
 ver the past 45 years, real returns (i.e. after inflation) amounted to 8,2% for equity; 2% for bonds; 2,2% for cash and 5,1% for direct property. (See table and graph below.) ver the past 45 years, real returns (i.e. after inflation) amounted to 8,2% for equity; 2% for bonds; 2,2% for cash and 5,1% for direct property. (See table and graph below.)- In 2013, real returns on equities amounted to 15,2% year-on-year, while property returned around 3,2%. Bonds and cash had negative real returns of respectively –4,5% and –0,4% y/y.
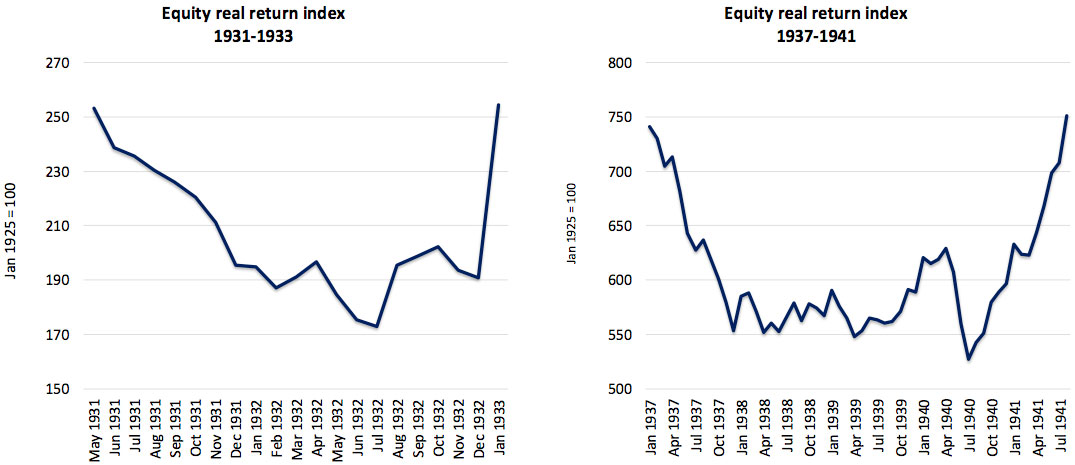
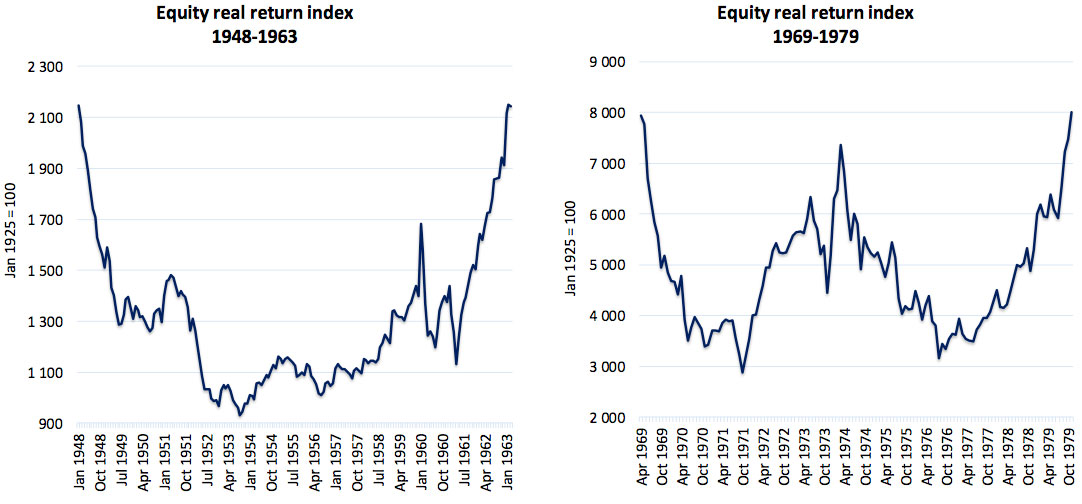
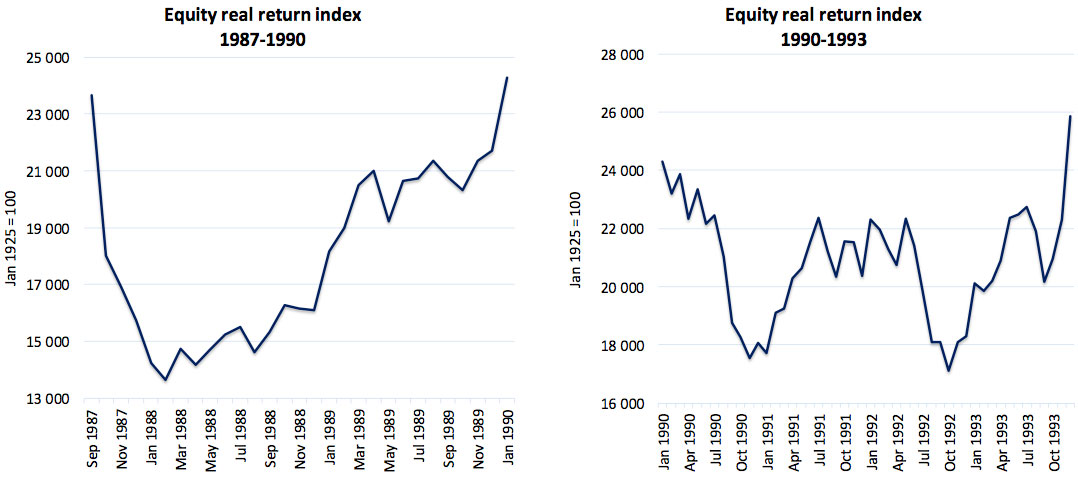
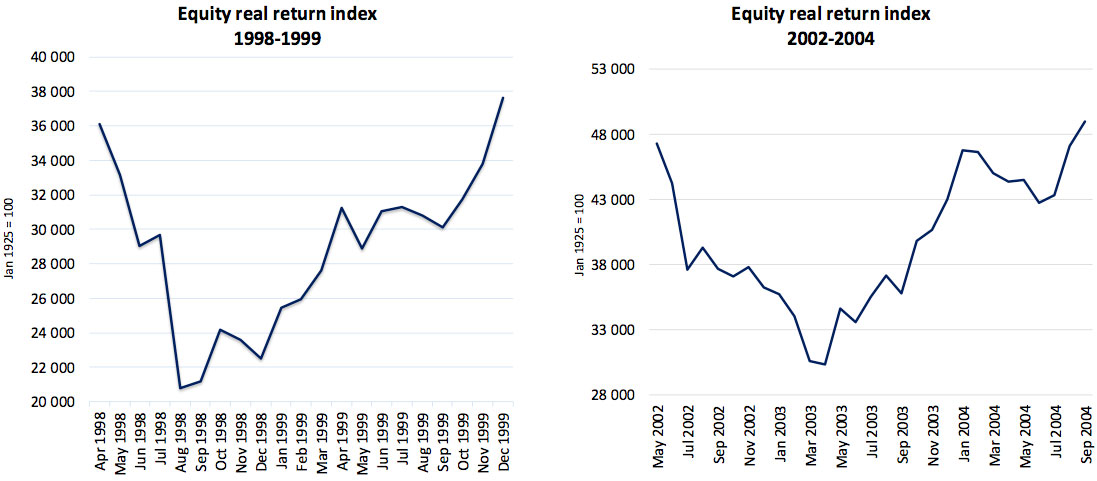
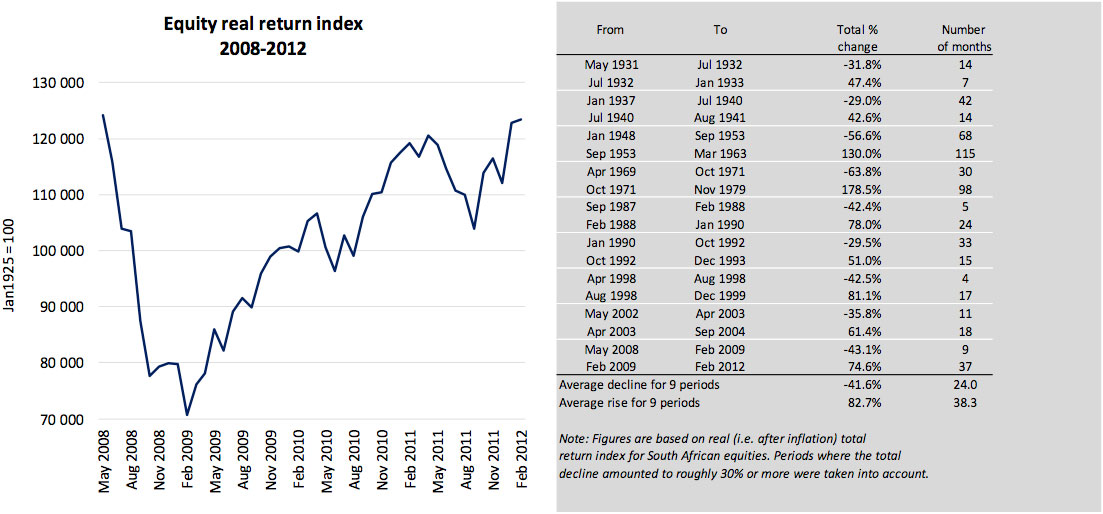
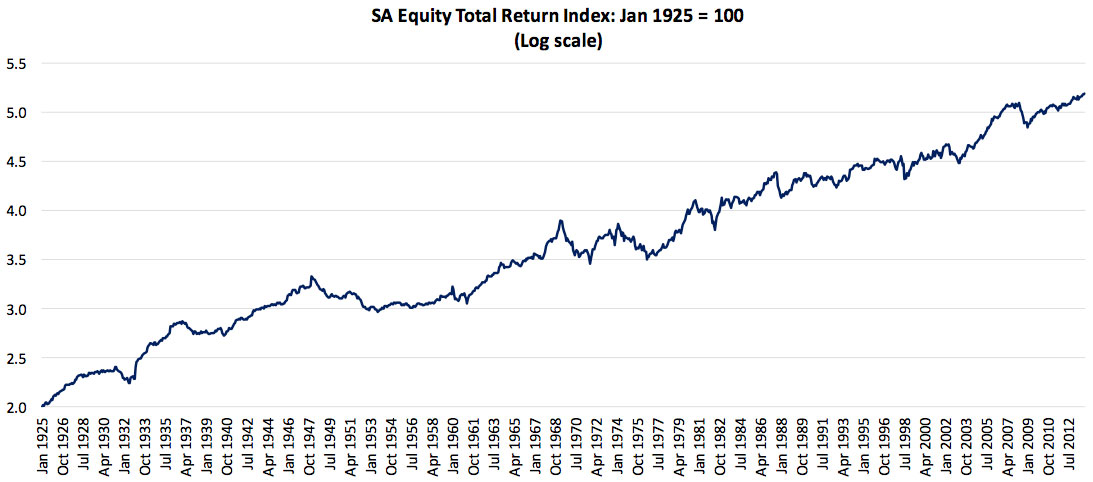
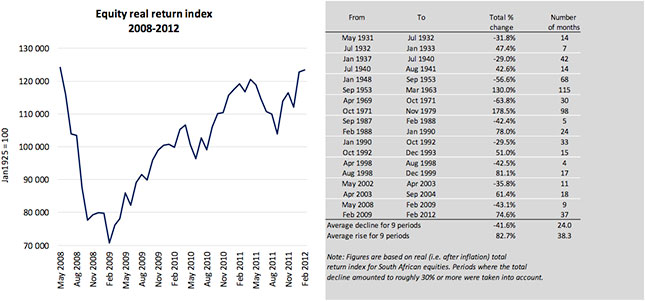
- Nine periods since 1925 were identified when the SAtotal real return equity index lost around 30% or more. Bear markets associated with such declines lasted on average 24 months, while all "losses" were recovered within 3 years and 2 months, on average. (See graphs and tables in document.)
- The longest equity bear market lasted for 68 months from Jan 1948 to Sep 1953, while it took nearly a decade (115 months) for the entire loss over this period to be wiped out.
- Because of volatility differences and the often uncorrelated nature of bond / cash / equity returns in relation to each other, diversification amongst asset classes is usually a good strategy. The optimal ex-post asset allocation over the past five years was 5% in cash; 20% in bonds; 65% in equity; and 10% in property. Over the past 10 years, this allocation would have been 5% in cash; 10% in bonds; 75% in equity; and 10% in property.
|

(Click on picture for larger view)



:: Back to top ::
|