|

  sually an investor would want to use some expected return on asset classes to construct a portfolio. A useful tool in this regard is the framework provided by Modern Portfolio Theory (MPT). MPT has to do with the process of measuring the riskiness of various assets, their interaction in terms of return behaviour, and how these can be used to determine the asset weightings in an “ideal” portfolio. However, because of the numerous explicit and implicit restrictions associated with the MPT framework, critics have questioned its appropriateness as an ideal investment strategy.
Nevertheless, because of its intuitive appeal in striking a balance between risk and return, the MPT framework remains an interesting and useful approach to evaluate a portfolio’s performance in a backward looking way. Investors can at least get some sense of how optimally structured portfolios would have performed – if only to provide some benchmark for their past returns, given a specific risk appetite.
Normally long time series are required to acquire reliable measures of risk and covariances of returns. We have monthly return data on South African equity, bonds and cash going back to 1925, whereas the gold price (in rand terms) dates back to 1965. We also have a direct property return index going back to 1968.
These data series were initially obtained from Carsons (later Ginsburg Malan and Carsons). This company was subsequently taken over by Alexander Forbes. More recent data on cash, bonds, equity and gold are available from sources such as I-Net and the most recent observations of direct property returns for 2009 and 2010 were obtained from IPD.

Estimating a return series for direct property holds a number of challenges. Typically, there is limited data for direct property and the time series available are smoothed. This underestimates the riskiness of the asset class, as many analysts would argue that property is riskier than bonds. The direct property return index was nevertheless seen as being a purer measurement of the asset class, since listed property also possesses significant equity and bond characteristics.
For different periods ending in 2010, the returns and risk measurements of the various asset classes were calculated, based on the data depicted in the graph above. Three of the periods are also summarised in the bar graphs below.

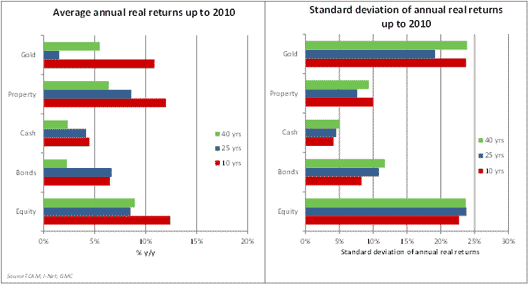
(Click to enlarge)
A few general observations can be made based on this data:
- Bonds have undergone tremendous improvements in returns over the respective periods. The reason is that inflation has been brought down and the government’s fiscal situation has improved dramatically – especially after 1995.
- Direct property returns likewise appear to have improved over time owing to a substantial rise in building activity and valuations – especially after 2000.
- Equity returns improved substantially over the past ten years, although both property and gold outperformed equity at times.
- Over more recent periods, bonds and cash have become less risky than they used to be. Risk measurements of other asset classes were relatively more stable over the different periods.
- Gold and equity remained the riskiest of the asset classes, whereas cash was the lowest over all of the periods.
An important input into the portfolio optimisation process is the covariances of the asset pairs. These covariances, which are the measurements of how well correlated asset returns are in relation to one another, are shown in the table below.

Looking at the 25-year period, for example, four asset pairs had negative covariances, meaning that their returns were mostly negatively correlated. Bonds and gold had the largest negative correlation. Of the positively correlated asset pairs, property and equity had the highest correlation, followed by bonds and equity. Property and cash had the lowest positive correlation.
Using non-linear programming methods, historical efficient frontiers for the past 25 and 10 years were constructed as shown in the graphs and table below. In essence, each of the return values was obtained by finding the particular mix of asset classes that gave the particular standard deviation (or risk level). Investors will often want to place upper and lower limits for certain asset classes in their portfolio, but in these calculations, no such constraints were placed on the asset class weightings.
The optimal asset percentages for unconstrained portfolios are depicted in the graphs for two periods: the past 25 years and the past 10 years. During the former period, a balanced portfolio could have returned a gross real return of between 5% and 8,5%, depending on the chosen risk level. For the latter period (the past 10 years), real portfolio returns have ranged between 7,6% and 12,4%.
Owing to the risk-return characteristics and negative correlations between cash and equity, these two asset classes featured strongly in portfolios during both historical periods. Allocations to cash were high for low-risk portfolios, whereas allocations to equity were high for high-risk portfolios. Direct property also featured strongly in the lower to medium-risk portfolios.


(Click to enlarge)
In essence, the MPT framework used to construct the portfolios above, emphasises the notion that assets in a portfolio should not only be selected on their own merits, but how they are interrelated in terms of risk and price. The trade-off between risk and return is therefore quite important.
There are nevertheless shortcomings when using the MPT approach on a forward-looking basis, the most important of which are that:
- Correlations between assets may not remain constant over time;
- Investors usually cannot accurately predict future returns;
- Asset returns are not always normally distributed random variables;
- All asset class risk cannot really only be captured by volatility.
The market turmoil of 2008/2009 again brought into question whether the MPT framework can still be utilised with confidence. In periods of distress – such as the one that we have just experienced – forced selling in both the equity and credit markets essentially pushed all correlations towards one. Many would argue that the simple and elegant mathematics of MPT requires some assumptions that may sometimes bear little resemblance to reality.
However, it would appear that for now, the most feasible way of circumventing MPT would be to make ad hoc assumptions on possible sources and magnitudes of risk. Therefore MPT probably still remains the most elegant and structured approach to allocate assets to a portfolio. In any event should the optimisation technique not be given free reign, but asset classes should ideally be constrained within pre-determined allocation ranges. These can very easily be added as constraints in the process described above.
|


