 Corporates
and Financial engineering: a few case studies
By Dr. A. A. Kotzé from Financial
Chaos Theory
http://www.quantonline
co.za

Abstract
 orporates enter the financial markets as natural hedgers for
their interest rate and/or foreign exchange exposures. Few
companies, however, utilise the equity derivative markets
to their advantage - to hedge certain corporate action events.
In this exposé we will discuss three case studies to
understand how equity derivatives are utilised by corporates
to assists them in reaching their goals. In the first case
study we will look at how Venfin used equity derivatives to
fund a transaction. We will then turn to corporate warrants.
In the second case study we will show how Richemont and Remgro
used these instruments prudently to sell some of their tobacco
interests. In the last case study we will turn to a transaction
between UBS and LTCM. Here we will highlight the risks in
using corporate warrants for the wrong reasons. Through the
case studies we also learn that payoff diagrams are essential
tools in understanding structured derivatives.
1. Introduction
The publication of the preference-free option pricing formula
by Fischer Black, Myron Scholes and Robert Merton in 1973
was a giant step forward in financial economics. Their model
established the everyday use of mathematical models as essential
tools in the world of finance. Since then option pricing theory
has developed into a standard tool for designing, pricing
and hedging derivative securities of all types. These tools
are mostly used by speculators and the investor community
where asset managers are looking for more effective hedging
strategies or low risk gearing opportunities.
Corporates, on the other hand, make little
use of equity derivatives. It is viewed as not being a natural
part of their business. However, there has been an important
shift recently in market share towards a growing use of equity
derivatives by the corporate sector at the expense of the
investor segment. This shift marks the coincidence of two
processes: the sophistication of corporate treasurers and
chief financial officers; and traditional capital markets
that are often not conducive to effective asset pricing. These
two factors have forced them to consider alternative financing
tools.
Corporates' desire to de-leverage and clear
the balance sheet of unpopular cross-shareholdings without
indulging in a fire-sale or a rights issue means they are
willing to look at other ways of monetising assets. The recent
Enron-like debacles and new accounting standards have thrown
the spotlight on equity derivative structures spurring a quantum
leap in treasurers' knowledge of financial engineering.
Equity derivatives are now an integral part
of the equity dialogue between banks and corporates. Reflecting
this change, almost all the major banks have restructured
to accommodate equity derivative specialists in their equity
capital markets function. This avoids separate teams accessing
the same company offering competing products [1].
In this exposé we will look at three
real-world transactions showing that corporates can make effective
use of equity derivative structured products; if these are
used prudently.
2. Option Basics
A derivative is a treasury/capital markets
synthetic off-balance sheet instrument derived from or bears
a close relation to a cash instrument. We need derivatives
because there are only two emotions that drive markets: greed
and fear.
There are thus two types of traders: speculators
and hedgers.
Now, speculators use derivatives to expose
portfolios to some market risk and hedgers use derivatives
to reduce the market risk they are exposed to. In technical
terms we can say that derivatives make a market more “complete”
i.e., investors have a bigger choice of instruments to invest
in.
An option is a non-linear derivative of which
we define two types: calls and puts. A call option gives the
holder the right, but not the obligation, to buy the underlying
asset by a certain date for a certain price. A put option
gives the holder the right, but not the obligation, to sell
the underlying asset by a certain date for a certain price.
The price referred to is known as the exercise price or strike
price. The date in the contract is known as the expiration,
expiry, exercise or maturity date [2], [3].
An option cannot be obtained free of charge.
There is a price attached to it called a premium. The premium
is the price paid for an option. The buyer of an option pays
a price for the right to make a choice — the choice
to exercise or not.
Call and put options are defined in one of
two ways: American or European. A European option can only
be exercised at the maturity date of the option whereas an
American option can be exercised at any time up and including
the maturity date.
3. Payoff Profiles
For most options and option structures, the
important issue for investors is what the possible payoff
profiles look like. A payoff profile shows the investor the
payoff that would be received if the underlying instrument
is at its current level when the option expires. It also shows
the investor the risk associated with the strategy: a future
has unlimited profit potential, but such a diagram also shows
the potential losses [2].
These profiles are popular because they clarify
the profit/loss scenario (possible risks) through a simple
diagram. They are also easy to work with because they are
additive, meaning that we can add or subtract them from one
another. This feature makes them useful in constructing more
complex financial instruments or strategies [3]. For a derivative
structure one will always look at the total or end profile.
Figure 1 shows the payoff diagrams for long and short future’s
positions while Figure 2 shows similar profiles for call and
put options. In Figure 3 we show the profile for a capped
collar. This structure is obtained by buying a future and
at-the-money put and by selling an out-the-money call (a call
spread can give a similar profile).

Figure 1: Payoff profile for a futures contract. K and K’
are the levels where the contracts were bought or sold.

Figure 2: Payoff profiles for options. K is the strike price

Figure 3: Payoff profile for a capped collar
4. Corporate Engineering – Venfin
(jse;VNF)
In Venfin’s interim financial report
for the six months ended 31 December 2002, the following was
reported:
- “On 31 December 2002, VenFin exercised the put
option acquired from Merrill Lynch International in respect
of 51 858 000 Richemont depositary receipts held by VenFin
(“the Richemont transaction”). The total cash
proceeds realised by VenFin as a result of exercising
the put option amounted to R945.2 million. A capital surplus
of R348 million was realised and is accounted for as an
exceptional item.”
- “VenFin acquired from Hosken Consolidated Investments
Limited (HCI) an additional 1.5% interest in Vodacom with
effect from 31 December 2002 for a total consideration
of R450 million. The proceeds from the Richemont transaction
were in part used to settle this amount. At 31 December
2002, VenFin’s interest in Vodacom was 15.0%”.
- “During April 2000 VenFin granted an indirect,
interest-free loan of R281.8 million to Sabido (Proprietary)
Limited (Sabido), the holding company of e-tv. An additional
R38.6 million was advanced to HCI for e-tv during the
2002 financial period. During January 2002, VenFin advanced
a further loan of R280 million to HCI. This loan was interest
bearing and fully secured. During September 2002 R199.4
million of this interest-bearing loan was converted into
an interest-free loan to HCI for e-tv. The balance of
the loan was repaid on 31 December 2002. If the interest-free
loans to Sabido and HCI were to be converted into equity
in Sabido on 31 December 2002, VenFin’s indirect
interest in e-tv would be 33.1%”.
Three corporate actions were announced through
SENS announcements on 29 August 2002, 9 September 2002 and
16 January 2003. The 9 September announcement stated
“VenFin has acquired a put option from Merrill Lynch
International (MLI) in respect of 51 858 000 Richemont depositary
receipts held by VenFin; and MLI has acquired a call option
from VenFin in respect of 51 858 000 Richemont depositary
receipts held by VenFin”.
Through these announcements we learnt that
Venfin used equity derivatives in these corporate action events.
These events were also linked. We will now explain how they
were linked and what was achieved [4].
4.1 History
In 1993 the then Rembrandt Group invested
R100 million into a new company called Vodacom. Vodacom successfully
tendered to obtain one of only two cell phone licenses issued
by the South African government. This investment secured 15%
shareholding in Vodacom for Rembrandt. The other shareholders
were Telkom (50%) and Vodafone from the United Kingdom (35%).
In 1995 Rembrandt sold 1.5% and Vodafone
3.5% of their shareholding in Vodacom to a black empowerment
company called Hosken Consolidated Investments Limited (HCI).
Rembrandt received R90 million for its 1.5% stake.
On 26 September 2000, Rembrandt Group split
into Remgro Limited and Venfin Limited. Venfin inherited 2%
of Richemont’s share capital with the split. This shareholding
was non-stategic. Venfin also inherited the 13.5% shareholding
in Vodacom.
During 2002 HCI has drawn loan funding from
Venfin of some R600 million to recapitalise e-tv.
4.2 Sound Investments and associated Risks
Venfin realized the potential of e-tv and
wanted to obtain a shareholding there-in. Venfin also wanted
to increase its shareholding in Vodacom that was, at that
point of time, extremely successful and profitable. The loan
of some R600 million to HCI set a series of transactions in
motion during August of 2002 to achieve these goals by 31
December 2002.
Venfin used the loan to cash-strapped HCI as an effective
negotiating tool in convincing HCI to part with its 5% stake
in Vodacom and to convert the loan into equity. After the
conversion Venfin owned 33.1% of e-tv (indirectly through
Sabido Investments).
Venfin needed to raise R450 million to fund
the 1.5% of Vodacom that it wanted to buy from HCI. Venfin
had various options like taking a loan from a bank. However,
it had the non-strategic stake in Richemont that it could
use. A simple solution could have been to sell shares at beginning
of September 2002, put the proceeds on deposit and buy the
1.5% stake on 31 December 2002.
However, Venfin knew that Richemont was going
to declare a dividend during September 2002 – they did
not want to compromise that tax-friendly income. Venfin needed
to find a way to sell the Richemont shares and secure their
dividend income at the same time. Venfin was also fully aware
of the risk that negotiations might fail – they needed
to consider that risk as well.
4.3 An Innovative Funding Structure
Instead of selling the shares outright, Venfin
put a zero cost collar in place. They bought a put on 51 858
000 Richemont shares from Merrill Lynch International. The
put was struck at R18.22. Venfin then wrote an out-the-money
call on the same Richemont shares – the call’s
strike price was never disclosed. The expiration date of the
structure was 31 December 2002. Venfin’s final payoff
diagram is depicted by the red profile in Figure 4. This can
be written as

Speaking on Moneyweb’s Classic Business
radio show , David Shapiro said the financing arrangement
was called a collar and involved Venfin putting up the shares
as security for a loan from Merrill Lynch. Shapiro described
the arrangement as a “new, innovative way in which to
loan money and to protect collateral”.

Figure 4: Venfin’s payoff profile by using a structured
derivative approach to funding.
4.4 An Efficient Hedge
Venfin used their holding in Richemont in
an innovative manner to fund the purchase of HCI’s Vodacom’s
stake. What has Venfin achieved through putting such a structure
in place?
- If negotiations failed Venfin did not have to exercise
the put option.
- Venfin kept all its rights until the deal was finalised
on 31 December 2002.
- Richemont declared a dividend with LDT date on 27 September
2002 (payable on 11 October 2002). This structure ensured
that Venfin received the dividend amounting to R17,076,839.40
(tax benefit).
- On 31 December 2002 Richemont’s share price was
R15.90. Venfin thus financed the deal at R18.22. Their
total income was R945.2 million. They obtained these funds
without sacrificing the dividend and they kept a door
open if negotiations failed.
- Part of the income from the structure was used to pay
HCI R450 million for a 1.5% stake in Vodacom.
Venfin enlarged their stake in Vodacom by,
efficiently, using a non-strategic investment in Richemont
5. Corporate Warrants: Richemont (jse;RCH) and Remgro
(jse;REM)
A corporate warrant is different to a retail
warrant trading on a bourse like the JSE Securities Exchange.
Retail warrants are issued by independent financial institutions
– there is no resultant effect on the issued share capital
of the underlying company.
On the other hand, corporate/company warrants, are issued
by the company itself on its own stock [2]. If corporate warrants
are exercised, the company receives cash (company’s
value increases) as well as the number of shares on issue
increases.
There are many advantages in issuing corporate
warrants:
- Cheap way to raise capital – the company receives
the premium upfront and capital later.
- There is more certainty in the capital-raising program.
- The issuing company does not have to pay any dividends
until the warrants are exercised.
5.1 Rembrandt’s and Richemont’s Tobacco
Interests
Rembrandt entered the South African cigarette
and tobacco industry in 1948 and in the fifties expanded their
tobacco interests abroad through the establishment of various
international partnerships. In 1972, the overseas tobacco
interests were consolidated in Rothmans International, which
was listed on the London Stock Exchange .
Rembrand separated its local and overseas
interests in 1988 with the founding of Compagnie Financière
Richemont AG (Richemont) – a Swiss-listed luxury goods
group which then also acquired the shares in Rothmans International.
During 1989 Richemont also acquired Philip Morris' 30 per
cent interest in Rothmans International.
In 1995 Rembrandt Group and Richemont consolidated
their respective tobacco interests in Rothmans International
– the world’s fourth largest cigarette manufacturer.
During June 1999 Rothmans merged with British American Tobacco
Plc (BAT) to form the world’s second largest cigarette
producer.. Rembrandt’s and Richemont’s investment
in BAT is held through R&R Holdings (a Luxembourg based
company) – Rembrandt and Richemont held 33 1/3% and
66 2/3% respectively. R&R owned 31.5% of BAT. During August
2000, Rembrandt split into Remgro and Venfin. Remgro inherited
Rembrandt’s tobacco interests.
5.2 Structure of R&R’s Holding in BAT
R&R’s stake in BAT was split into 26.5% ordinary
shares and 5% preference shares with embedded put options
at a strike of 675p. The preference shares amounted to some
120.9 million shares and the put options expired on 7 June
2004. Another condition was that the preference shares automatically
converted into ordinary shares on a one to one basis on any
sale to a third party.
5.3 Remgro and Richemont’s Goal
Both Remgro and Richemont wanted to lighten
their exposure to the tobacco sector. On 11 December 2002
Remgro and Richemont issued separate but similar SENS announcements
reading:
“Compagnie Financiere Richemont SA (RCH) announces that
its subsidiary, R&R Holdings SA is to offer 120.9 million
secured European-style call warrants exercisable only upon
maturity, at the option of the warrant holder, into ordinary
shares of British American Tobacco p.l.c. (‘BAT’).
The warrants, which will expire in May 2004, are exercisable
at 675p per warrant.”
In Remgro’s financial report for the
year ended 31 March 2003 the following was stated:
“In January 2003, R&R issued secured call warrants
exercisable into ordinary shares of BAT in 2004. This transaction
effectively locked in the value of the 120.9 million convertible
redeemable preference shares which R&R has in BAT and
which it was obliged to either sell or tender for redemption
in June 2004 at the redemption price of 675 pence per share.
Together with the gross warrant premium of 34.29 pence per
share received in January 2003, the value locked in amounted
to 709.29 pence per share, before costs..… As a consequence
of the warrant issue, the preference shares are now treated
as a debt instrument in the consolidated accounts of R&R
and are no longer equity accounted.”
By issuing the warrants R&R locked in
the value of the preference shares. The warrants transformed
R&R’s market exposure to the BAT share price into
a debt instrument. How was that achieved? We explain this
by looking at the resultant payoff profile.
5.4 The Resultant Structure
We digress slightly to define a useful concept
called put-call-parity. This is a fundamental relationship
in option pricing theory [2]. Put-call parity is a relationship
that exists between the prices of European put and call options
where both have the same underlier, strike price and expiry
date. Accordingly, we have the price equality:

where:
c = the current market value of a call;
PV(k) = the present value of the strike price , discounted
from the expiration date at a suitable risk free rate ;
p = the current market value of the put;
s = the current market value of the underlier.

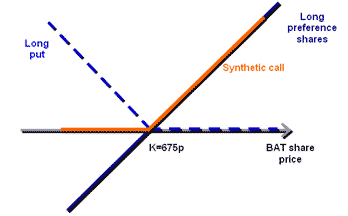
Figure 5: R&R’s synthetic call position

Figure 6: Resultant payoff after issuing corporate warrants
5.5 An Effective Hedge
In June 2004, R&R Holdings received GBP
816 million, due to the exercise of the warrants by the warrant
holders. By issuing warrants R&R
- Earned premium income;
- had a guaranteed buyer of its 5% stake in BAT;
- locked in the selling price guaranteeing the income
of GBP 816 million.
The rationale behind the issued warrants
was that R&R wanted to sell its 5% stake in BAT. It had
a structure in place that in essence was a synthetic call
option. This option had some time to run until its expiry
date of June 2004. Options have time value and R&R sold
the time value and option rights embedded in the synthetic
call, realising it early. The payoff profile shows that R&R’s
resultant position was square - R&R had no price risk
to the BAT share price and hence R&R could treat the structure
as a debt instrument in its financial reports.
Issuing warrants was a conservative strategy
to effectively hedge and sell its 5% stake in BAT.
6 Corporate Warrants: LTCM vs. UBS
6.1 A Short History on LTCM
Long Term Capital Management (LTCM) was a
hedge fund located in Greenwich, Connecticut. The founders
included two Nobel Prize-winning economists, Myron Scholes
and Robert C. Merton. The idea behind LTCM was quite simple
to articulate but not necessarily that easy to implement.
LTCM was to look for arbritage opportunities in markets using
computers, massive databases and the insights of top-level
theorists. By creating hedged portfolios the risks could be
reduced to low levels. According to the model developed by
Merton the risk could be reduced to zero, but in practice
some of the crucial assumptions of Merton's model did not
hold so the risk of the hedged portfolios was not really zero,
as subsequent events proved [5].
LTCM's main strategy was to make convergence
trades. These trades involved finding securities that were
mispriced relative to one another, taking long positions in
the cheap ones and short positions in the rich ones. There
were four main types of trade:
- Convergence among U.S., Japan, and European sovereign
bonds;
- Convergence among European sovereign bonds;
- Convergence between on-the-run and off-the-run U.S.
government bonds;
- Long positions in emerging markets sovereigns, hedged
back to dollars.
Because these differences in values were
tiny, the fund needed to take large and highly leveraged positions
in order to make a significant profit. At the beginning of
1998, the fund had equity of $5 billion and had borrowed over
$125 billion — a leverage factor of roughly thirty to
one.
From the above we see that LTCM was mostly
involved in the bond markets where it played the credit spread
between mortgage-backed securities or double-A corporate bonds
and government bonds. Then it ventured into equity trades.
It sold equity index options with big premium income for 1997.
It took speculative positions in takeover stocks and it played
big in the Russian debt markets [6]. At one point, Russia
was nearly 8% of its book; that amounted to $10 billion!
6.2 LTCM’s Collapse
LTCM’s woes started on 17 August 1998
when Russia devalued the rouble and declared a moratorium
on 281 billion roubles ($13.5 billion) of its Treasury debt.
The result was a massive "flight to quality", with
investors flooding out of any remotely risky market and into
the most secure instruments within the already "risk-free"
government bond market. Ultimately, this resulted in a liquidity
crisis of enormous proportions, dealing a severe blow to LTCM's
portfolio. By 23 September 1998, LTCM was near collapse with
investors loosing millions of dollars.
On Saturday 26 September 1998, the International
Herald Tribune, reported that the biggest losses due to the
failure of Long Term Capital Management (LTCM) amounted to
- Credit Suisse, Europe's sixth-biggest bank - $55 million
- Dresdner Bank - $142.6 million
- Union Bank of Switzerland (UBS), the world's second-largest
bank - 950 million Swiss francs ($682 million).
6.3 The Union Bank of Switzerland (UBS) Connection
Why did UBS lost so much money due to the
failure of a hedge fund? The answer lied in the fact that
LTCM was an extremely successful hedge fund making excessive
returns for its investors. This success brought LTCM and UBS
together and both parties saw they had complementary goals:
- UBS wanted to buy a significant stake in this successful
fund. That was very difficult to achieve.
- On the other hand, LTCM’s partners wanted to
convert foreign interest income from their offshore hedge
fund into capital gains and defer it for seven years.
The deal was a variation on other attempts
to turn a hedge fund into a securitized asset class with a
protected downside. UBS took on the risk and protected the
downside. The sweetener for UBS was a structure that looked
more like an option than a loan, turning any income into a
capital gain, and an opportunity to invest directly into LTCM.
UBS saw great opportunity in rolling this structure out to
other hedge funds.
The deal solved a tax problem faced by LTCM
and other hedge funds: most funds are set up as partnerships
or limited liability corporations. Income from the fund flows
directly to the partners in the form of short-term profits
or interest and dividends, which are taxed at 39.6 percent.
Long-term capital gains, by contrast, are taxed at 20 percent.
6.4 The UBS Deal
For a premium of $300 million UBS sold to
the LTCM partners a seven-year European call option or warrant,
on 1 million of LTCM's own shares, valued then at $800 million.
The strike price of the option was set at 80 percent of the
forward value of LTCM at the time the transaction was struck.
This amounted to $575 million.
To hedge the position UBS bought $800 million
worth of LTCM shares directly from the partners themselves.
UBS invested the premium of $300 million directly back into
LTCM. Such an investment had to be held for a minimum of three
years. Any shares sold by UBS back to the LTCM partners had
to be converted into a loan at par value. The trade was approved
at the highest level of management within UBS—the CEO,
the head of credit and the head of the derivatives group.
The trade also received board approval.
This transaction was completed in three tranches
in June, August and October 1997. UBS booked an estimated
$30 to $50 million of profit up front.
6.5 A Clever Deal
The premium was calculated such that it was
equivalent to a coupon of Libor plus 50 basis points on $800
million paid over the seven years – this amounted to
$300 million. Why was this the case and why did LTCM fell
for such a deal? LTCM secured $800 million new investment
capital at Libor plus 50 basis points. Due to its risky trading
activities LTCM could never borrow money at those levels.
LTCM also had a call on all returns above that level. UBS's
obligation to convert any shares it wanted to sell into a
loan provided LTCM with a synthetic seven-year put on its
own performance. From LTCM’s point of view it was a
real clever deal.
On the other side, UBS would have gotten
its capital back after 7 years by selling the shares at the
strike price of $575 million. It also secured an opportunity
to invest into the hedge fund. The payoff profile of this
transaction is shown in Figure 7. This clearly shows the risk
UBS took onto its book.
By doing the deal UBS was long LTCM shares
and short a call on LTCM shares. Put-call-parity states that
such two trades together are equivalent to a short synthetic
put option. This is shown by the resultant payoff diagram
(red profile) in Figure 7. Being short a put is a very risky
strategy. A proper hedge for a short put is a short position
in the underlying share – delta hedging is done by selling
the underlying share.

Figure 7: UBS’s resultant position after the transaction
6.6 UBS’s Risk Management
The risk managers at UBS should have known
about put-call-parity and they should have known how a short
put position should be hedged. This would have led them to
notice that the main risk lied in the illiquidity of the LTCM
shares. Proper stress tests and scenario analysis would have
pointed to the possible losses if the LTCM share price did
collapse. However, UBS’s risk managers never considered
the possibility of a collapse of LTCM.
But, when Russia defaulted on some of its
loans, share markets around the world went into a tailspin.
During crash situations liquidity dries up and LTCM’s
share was no exception to this generally accepted rule. UBS
could not delta hedge its short synthetic put by selling LTCM
shares in the open market. LTCM’s share price collapsed
and UBS lost $682 million. The LTCM fiasco is full of lessons
about:
Model and liquidity risk;
- Unexpected correlation or the breakdown of historical
correlations;
- The need for stress-testing combined with sound judgment;
- The value of disclosure and transparency;
- The danger of over-generous extension of trading credit.
Driven by greed and the wrong reasons UBS
bypassed proper risk management practices and lost $682 million
by issuing options in size on an illiquid stock.
7. Conclusion
Corporates can utilise equity derivatives
effectively and efficiently if they understand the risks involved.
The risks are clear when simple payoff diagrams are used to
analyse derivative structures. The three case studies show
that prudent corporates can utilise options on equities for
corporate action events - to fund the purchase of a stake
in another company or to sell a shareholding in a company
efficiently and lock in returns. On the other hand, if the
risks are not understood and risk management practises not
adequate, a corporate can loose a substantial amount of money
Bibliography
[1] C Smith, Equity derivatives enter the dialogue, The
Banker, June (2002)
[2] J. Hull, Options, Futures, and other Derivatives,
Prentice-Hall (1997)
[3] A. A. Kotzé, Equity Derivatives: effective
and practical techniques for mastering and
trading equity derivatives, a Financial Chaos Theory publication,
June (2002)
[4] A. A. Kotzé, The Practical Application of
Equity Derivatives for Fund Managers and Corporates, a Financial
Chaos Theory publication, August (2003)
[5] J. K. Glassman, Long Term Capital Management: Summary
of the Nature of LTCM, http://www2.sjsu.edu/faculty/watkins/ltcm.htm
[6] D. Shireff, Lessons from the
collapse of hedge fund, Long-Term Capital Management, http://riskinstitute.ch/146480.htm
This article is published for general information
and is not intended as advice of any nature. The viewpoints
expressed are not necessarily that of Financial Chaos Theory
Pty. Ltd. As every situation depends on its own facts and circumstances,
only specific advice should be relied upon.
|


