South Africa's growing public debt
by Christo Luüs
Third Circle Asset Management


 Introduction Introduction
 he running of fiscal surpluses during the period 2006 to 2008, changed dramatically in 2009 when Government’s counter-cyclical fiscal policy saw the emergence of large deficits and an accompanying rise in its debt commitment. The growing burden of maintaining a bloated civil service sector and an already extensive system of social grants with elaborate plans to expand this even further, have kindled fears of an unsustainable burgeoning of public debt as a ratio of the country’s GDP in years to come. he running of fiscal surpluses during the period 2006 to 2008, changed dramatically in 2009 when Government’s counter-cyclical fiscal policy saw the emergence of large deficits and an accompanying rise in its debt commitment. The growing burden of maintaining a bloated civil service sector and an already extensive system of social grants with elaborate plans to expand this even further, have kindled fears of an unsustainable burgeoning of public debt as a ratio of the country’s GDP in years to come.
In late 2011 and early 2012, two of the large international credit ratings agencies changed their outlook on South Africa’s sovereign risk rating from stable to negative. Moody’s noted that there was a “...growing risk that the political commitment to low budget deficits and the ability to keep within current debt targets could be undermined by popular pressures.” They also commented that “... calls for a greater state involvement in the economy and for a larger push on redistribution are being made very loudly from some parts of the ANC sphere, but it remains far from clear as to what changes in broad policy, if any, might be agreed in the course of 2012.”
Fitch was concerned about the failure to create enough jobs and to speed up economic growth. They commented that “...this inability has not only constrained growth and kept the tax base narrow but has also caused public finances to become increasingly redistributive in an effort to address the lack of social mobility. The resultant narrowing of fiscal space undermines a key support to South Africa's creditworthiness.”
When evaluating the impact and sustainability of fiscal deficits, it is important to distinguish clearly between (i) their impact on the flows of savings and investment in the economy; and (ii) their impact on the outstanding stock of government debt in relation to GDP, and the budgetary cost of servicing such debt. It is the second of these two aspects of public borrowing policy which we will investigate. In essence, the question can be formulated as follows: Do the accumulated government debt and annual additions to it impose constraints on fiscal policy and the economy, in addition to those arising from the need to shape current deficits in relation to the current and expected flows of savings and investment?
Some fiscal calculus
In simple terms, the reciprocal relationship between budget deficits, interest payments and the public debt can be explained as follows: If government were to incur a budget deficit in a particular year, this would add to the volume of outstanding debt, and additional interest would have to be paid on this higher debt level in ensuing years. This interest would form part of budgetary outlays in the following years, and unless tax revenues are higher than before or other expenditures are reduced in time to come, the budget deficit could become progressively higher.
The question is, will the escalation of interest payments in this way cause the outstanding debt and interest payments to expand indefinitely or to unacceptable levels? To answer this question, one requires some knowledge of the fiscal calculus, which deals with the evolution of the debt/GDP ratio over time, based on the complex interaction between the economy, the budget deficit and the outstanding debt.
A key proposition is that the conditions for stability of the debt/GDP ratio can be expressed in terms of two statistics: (i) the so-called primary fiscal balance (q), defined as the total budget deficit or surplus less interest payments; and (ii) the difference between the growth rate of nominal (or real) GDP (y) and the average nominal (or real) interest rate on the outstanding debt (r), i.e. the so-called growth/interest rate differential (y-r). The fiscal calculus predicts various possible outcomes for the debt/GDP ratio, based on different values of q, y and r.
Table 1 provides a summary of the conditions for stability of the debt/GDP ratio in terms of q, y and r (henceforth nominal interest rates and nominal GDP growth rates will be used).
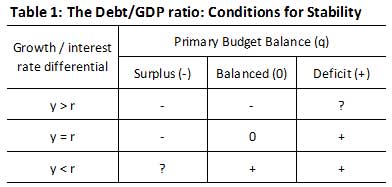
From a purely mechanical point of view, when the growth rate of the GDP is higher than the average interest rate on the debt (i.e. y > r), the debt ratio will not be explosive, irrespective of whether the primary balance is in deficit, balance or surplus. Indeed, a positive growth/interest rate differential, combined with a primary deficit, will be associated with the following asymptotic or steady-state debt ratio:
(debt/GDP)* = (-q)(1 + y)/(y - r) ... equation 1
where (debt/GDP)* is the steady-state ratio and the other variables as described above.
The latter will be higher, the smaller the positive growth/interest differential. Whether the actual debt ratio will rise or fall depends on whether the initial debt ratio lies below or above the asymptotic ratio. By contrast, a positive growth/interest rate differential combined with either a primary surplus or a balanced primary budget, will cause the debt/GDP ratio to fall in the direction of an infinite accumulation of net assets.
When the growth rate of the GDP equals the average interest rate on the outstanding debt (y = r), the interest component of the budget deficit grows at the same rate as the GDP, and it therefore has no effect on the debt ratio, whatever its level. In this case, the outcome will depend solely on the primary budget balance. If the primary balance is in deficit, the debt ratio will grow explosively, but if the primary balance is in surplus, the debt ratio will implode. It follows that when the primary budget is balanced, the debt ratio will remain constant.
By contrast, when the average interest rate on the outstanding debt exceeds the growth rate of the GDP (y < r), a primary budget in balance or in deficit will clearly lead to an indefinite (explosive) increase in the debt ratio. However, a primary surplus combined with a negative growth/interest differential will give rise to so-called knife-edge cases, where the debt ratio is delicately balanced between two extremes. In this situation, the debt ratio would rise without limit if the primary surplus is below a certain threshold level. If the surplus is above the threshold level, government will eventually accumulate infinite net assets. The threshold primary surplus q* is defined as:
q* = (debt/GDP)0(r - y)/(1 + y) ... equation 2
where (debt/GDP)0 is the initial or current debt ratio.
The debt ratio will remain stable if the primary surplus is equal to the threshold level.
The concept of a public debt trap is frequently defined in terms of the foregoing conditions for stability of the debt ratio. Particular emphasis is then usually placed on the conditions under which the ratio would rise explosively, i.e. indefinitely.
It should be noted that, according to Table 1, the debt ratio would rise explosively when (i) the growth/interest differential is zero and government runs a primary deficit, or (ii) the growth/interest differential is negative and government runs either a primary budget deficit, a balanced primary budget or a primary budget surplus which is below the so-called threshold level (see equation 2). If the primary surplus is above the threshold level, the debt ratio will fall indefinitely. By contrast, a positive growth/interest differential (y > r), combined with a primary fiscal deficit (q > 0 in Table 1), is associated with a steady-state debt ratio which may lie below or above the current debt ratio. If the steady-state ratio lies above the current level, the actual ratio would rise, albeit to possibly high levels, but not explosively (indefinitely).
It follows from the above that the existence of an adverse growth/interest differential or a primary fiscal deficit, are by themselves not sufficient conditions for the existence of an explosive debt situation. It is the dynamic interaction between these variables that could lead to an unsustainable rise in the public debt ratio.
Fiscal unsustainability can in turn be seen as a necessary but not sufficient condition for the existence of a debt trap. Accordingly, for a debt trap to exist, it must also be impossible to escape from the condition of unsustainability. After all, a trap is a device which provides an entrance but no exit.
Historical debt projections
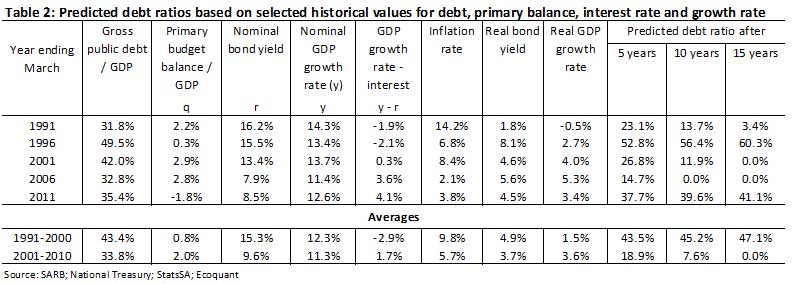
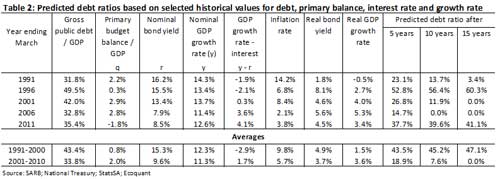
Table 2 summarises the relevant fundamentals of the 1998/1999 to 2010/2011 fiscal years and the corresponding debt projections, based on certain assumptions for the economic fundamentals. These fundamentals include the nominal GDP growth rate, the nominal interest rate (bond yield), and the inflation rate (implicitly).

The prospective national debt ratios (debt/GDP)t indicated in the table, were retrospectively projected according to the following formula:
(debt/GDP)t = q(1 +y )/(r - y)(((1 + r)/(1 + y))t - 1) + (debt/GDP)t-1((1 + r)/(1 + y))t
... equation 3
In the above equation, (debt/GDP)t refers to the prospective future debt ratio after t years, while q, r and y have the meanings as described previously. In respect of each fiscal year, the forward projections are based on the assumption that the conditions which prevailed in the base year remained unchanged over the forecast period.
The projections of the debt ratio therefore attempt to answer the question: What would happen to the debt ratio if the underlying budgetary situation and economic fundamentals remained unchanged?
The figures in respect of q are not cyclically adjusted. For this reason, the debt projections in Table 2 must be interpreted in the light of business cycle movements during the period under review. The relevant debt and interest concepts employed are the gross debt of the national government and gross pre-tax interest payments. Finally, the projections are based on the assumption of a future one-to-one relationship between national budgetary deficits and the growth of the gross debt of the national government.
(Click on image for larger view)
The outcome of the calculations may be summarised as follows:
- For the 1990/91 fiscal years, the fiscal calculus predicted a falling debt ratio in each year. However, the onset of a downward phase in the business cycle in March 1989 – which had a duration of no less than 51 months – severely impacted on the fiscal deficit. As a result, public debt levels soared from less than 30% of GDP, to more than 48% during the period 1994-1998.
- The decline in the economic growth and relatively high inflation, caused y-r to turn negative, while the primary fiscal balance went into deficit during 1993 and 1994. These adverse conditions caused the predicted debt ratio to indicate a potential rise to nearly 60% – although this could have been much worse was it not that the primary balance was already showing a small surplus in 1995/96.
- For most of the first decade after 2000, the prediction was for a sustained decline in the debt ratio. This came about as a primary budget surplus was maintained, economic growth improved and lower inflation caused a drop in nominal interest rates.
- The difference between the 1990s and 2000s is also quite stark, looking at the predicted outcomes for debt, if the average values that applied to q, r and y are used as assumptions (the two bottom rows of table 2). The positive nominal growth/interest rate differential, higher primary budget surplus and much lower debt financing cost meant that the fiscal situation showed a consistent improvement and elimination of debt if the situation could be maintained.
The fiscal situation which developed with the onset of the recession in 2009, clearly deteriorated substantially as far as the fiscal primary balance was concerned. In fact, the fiscal primary deficit at 3,1% of GDP in 2009/2010 was even bigger than the 2,7% deficit recorded in 1992/1993. Fortunately, relatively low bond yields has remained in place while the growth/interest rate differential has remained mostly positive since 2009, despite three quarters of negative real economic growth being recorded in 2009. So, despite the deterioration in the outlook for debt, its ratio of GDP still did not appear to be on an explosive trajectory, based on the fiscal calculus.
State debt projections: some future scenarios
To recap, the foregoing analysis implies that the future direction of the public sector debt-to-GDP will be highly dependent on the following factors:
- The current or initial debt-to-GDP ratio (i.e., the point of departure)
- The primary fiscal balance (i.e. the difference between government revenue and expenditure, excluding interest expenditure)
- The interest rate (bond yield) payable on the outstanding public debt
- The growth rate in the nominal GDP (i.e., real GDP plus inflation)
From what has been said, it also follows that the public debt as a ratio of GDP will become higher at a more rapid pace if a combination of adverse developments in one or more of the abovementioned variables occur. The running of primary deficits and a negative growth/interest rate differential (i.e. y<r) will most certainly lead to an explosive debt-to-GDP ratio if these are maintained for a prolonged period of time.

(Click on image for larger view)
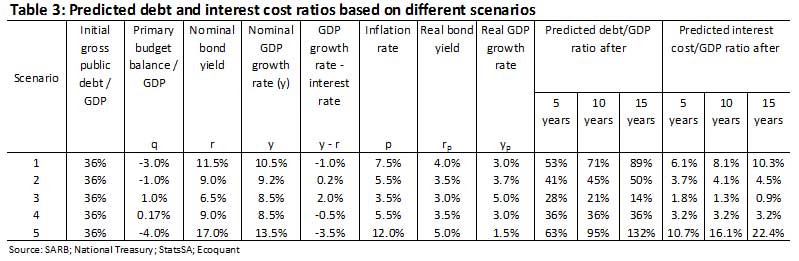
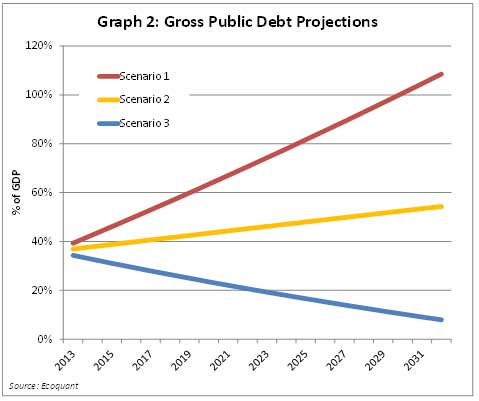
Table 3 and graph 2 depict some possible outcomes for the public debt over the next 5, 10 and 15 years. To construct these scenarios, various different combinations of assumption were made for economic growth, the level of interest rates and the primary fiscal budget balance of government. In all of the scenarios, a 36% debt-to-GDP ratio (the ratio that prevailed at the beginning of the 2011/2012 fiscal year) was taken as the point of departure.
Scenario 1 assumes that government will structurally deviate from its previous policy of running a primary budget surplus, and that this deficit will average 3% of GDP over the forecast period. Excessive government spending and large deficits are likely to impact on the country’s sovereign risk ratings, depress the currency and fuel inflation. Therefore the nominal GDP growth is bound to be lower than the nominal interest rate, although real economic growth of 3% is still implicitly assumed. This scenario will see the public debt grow fairly rapidly – to the highest levels ever recorded for the country – reaching nearly 90% by 2027.
Scenario 2 is a more “middle of the road” scenario where the average primary budget deficit is limited to 1% of GDP, inflation is contained to around 5,5% and the economy grows by 3,7% p.a. Consequently a small growth/interest rate differential is maintained, with the result that public debt rises, but not explosively so. In 15 years’ time the fiscal calculus predicts the debt-to-GDP ratio to rise to 50%.
Scenario 3 is the most optimistic scenario, assuming economic growth of 5%, inflation of 3,5% and a primary budget balance of +1% p.a. These factors will cause a perpetually declining debt ratio, reaching 14% of GDP by 2027.
Scenario 4 shows the primary budget balance that will cause the public debt ratio to remain stable at 36%. Given the assumptions which will give rise to a small growth/interest rate differential, a primary budget surplus of 0,17% of GDP needs to be maintained to cause a stable outcome for debt.
Scenario 5 is a worst case scenario, depicting low economic growth, high inflation and thus nominal interest rates, and a primary deficit which will average 4% of GDP. Predictably, the public debt under these conditions, will grow explosively which will most likely give rise to the onset of a debt trap situation. At this high level of debt (132% of GDP in 2027), the total budget deficit would exceed 26% of GDP, with interest payments equalling 22,4% of GDP. Interest payments of this magnitude would involve a disastrous and politically inconceivable crowding-out of other government expenditure. Moreover, fears in financial markets of debt monetisation, or even more likely – a debt repayment default – would push up interest rates to extremely high levels. The effect of the latter on economic growth will be negative, while inflation will soar. The national government might be tempted to spend or inflate itself out of its predicament, with y rising relative to r. However, this would merely be a temporary reprieve since interest rates would catch up in time. Presumably the national government would want to avoid such a vicious circle, because the outcome will be a stagnant economy combined with an escalating inflation rate.
Considering what scenario may unfold over the next few years, will depend mainly on the ability of government to resume the reductions in the primary fiscal deficit as a ratio of GDP which prevailed during most of the past two decades. If inflation is contained so that the current relatively low nominal interest rate environment can be maintained and economic growth can be sustained, there is little likelihood that South Africa will be caught in a so-called debt trap. For now, the historical values for q, y and r that applied during the past couple of decades (taking the business cycle effects into account) will have to worsen dramatically for a debt trap situation to evolve.
Achieving reductions in the primary fiscal deficit could nevertheless become progressively more difficult, for several reasons. Firstly, there exists a substantial reservoir of unsatisfied demands for public spending, most notably for grants and other social benefits. Government has actively been fuelling demands for an elaborate healthcare system and education services and, in addition, would want to widen its commercial participation in the economy. These will all need a lot of resources. Secondly, the economy appears to be reaching its zenith in terms of the magnitudes by which taxes can be raised further. In any event, during a normal cyclical decline, tax revenues in relation to GDP will tend to fall, so structurally high levels of government spending will always carry the risk of high budget deficits.
Policy implications
From the aforementioned analysis, one can state with a fair degree of comfort that South Africa is not close to a debt trap situation. In fact, relatively small adjustments in the primary budget balance should be sufficient to stabilise the debt / GDP ratio or even bring it down again. In addition, the statements by government thus far do not suggest that the budget deficits, which are projected to continue over the next three years, will become a structural feature of the economy. In fact, the primary budget deficit is budgeted to decline significantly by 2014/2015.
However, it would probably be prudent for government, especially in view of the concerns expressed by rating agencies, to consider establishing fiscal rules or targets which ought to be followed.
The first policy implication of the foregoing analysis is that the national government should resume its efforts to reduce the national budget deficit (the prime source of increases in the public debt). However, with regard to the national budget, it is obvious that further efforts to reduce the budget deficit via tax increases and/or spending limitations would, in the short term, not be costless in socio-economic and political terms. Such efforts would therefore have to be undertaken in accordance with appropriate targets and a reasonable time-scale for their implementation.
The government is predicting a primary budget deficit until 2014/2015, but this will need to change as soon as possible thereafter back to a surplus. The environment is still fairly forgiving in terms of low nominal (and real) interest rates which are aiding the cost of servicing the debt, but these are unlikely to last forever.
(Click on image for larger view)
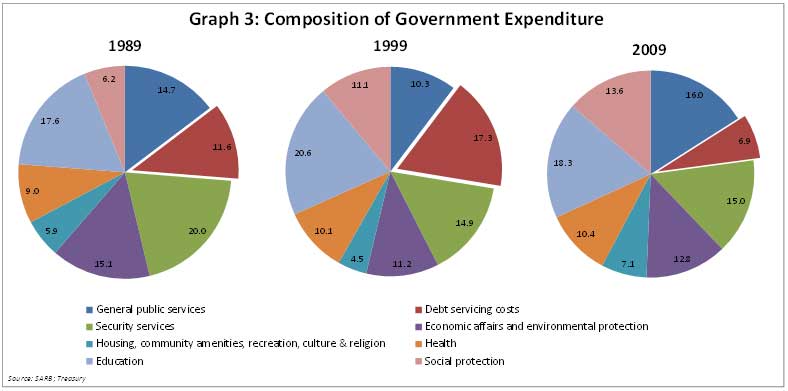
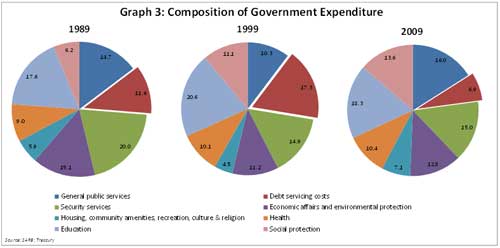
Closely related to this concern are the monetary implications that might arise from adverse market (domestic and foreign) expectations resulting from a possible further worsening of the budgetary/debt situation. It is therefore important that government should demonstrate its ability to address these concerns by gradually reducing the proportion of total government spending that is devoted to servicing the national debt. In 2008/2009 the proportion of total government expenditure which was used for debt financing was 6,9% (see graph 3). In the meantime, this has crept up to 8,6% in 2011/2012, while the medium-term estimates show a further rise to 9,6%. In 1999 this ratio was as much as 17,3% which severely constrained government’s ability to devote resources to other functions, and such an adverse position should be avoided from arising in future.
While interest rates are of course also affected by monetary policy, government’s overall tax and expenditure policy should be conducted within the context of the imperative to limit interest payments in the budget.
Moreover, the need for both credibility and transparency dictates that such a goal be relatively specific; that it be pursued in a medium-term context; and that it includes government’s total interest commitment, i.e. both explicit interest payments and implicit interest in the form of discounts on the issue of government stock, attributable to each fiscal year.
It would appear that earlier intents by Mr Trevor Manuel (Minister of Finance during 1996-2009) to limit government consumption expenditure as a ratio of GDP to 25%, have fallen by the wayside. Indeed, only in 2000/2001 and 2002/2003 was government expenditure below this ratio. In 2009/2010, the ratio increased to more than 29%, although this came about mainly as a result of the recession.

Views abound as to the growth impact that increased government spending has on economic growth. The immediate impact of higher spending will of course be that GDP increases, while multiplier effects will also be present. However, excessive government spending tends to crowd out the private sector, especially if higher spending is financed by taxes to avoid the deficit from increasing as well.

(Click on image for larger view)
Unfortunately, a sad reality is that much of the spending of government is perceived to be unproductive: government employment and remuneration has increased, but service levels – especially at lower levels of government – have not. This is why government should consider to not only include the budget balance as a fiscal policy target, but also government expenditure, expressed as a percentage of GDP.
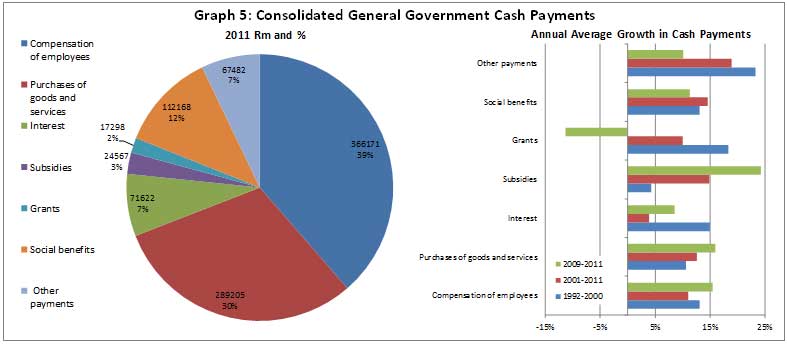
Public sector debt is now more than R1 trillion and general government expenditure is likewise going to break through the R1 trillion level in 2012/2013. Graph 3 gives some perspective of the functional classification of government expenditure. But looking at what the cash disbursements of government, graph 5 gives another, more recent view on government expenditure. Compensation of employees, accounting for nearly 40% of general government cash payments, have consistently outstripped the annual inflation rate over the past 20 years. Over the past three years, this item had escalated by no less than 15,5% p.a. Limiting the growth of government’s wage bill would be a good starting point for capping total expenditure in relation to GDP.
Finally it remains imperative that economic policies remain focussed on increasing economic growth (y) since this process can forgive many policy shortcomings or “sins”. The reason, in terms of the fiscal calculus, is clear: deficit and debt ratios are all expressed in terms of GDP. A growing economy creates space for government to manoeuvre out of tight corners and allow for flexibility with regard to policy options.
A precondition for economic growth, is relative price stability – i.e. low inflation. However, the inflation rate also has a much more direct influence on the financial calculus in the sense that nominal GDP growth (y) and nominal interest rates (r) both depend on the rate of inflation. Unfortunately, high inflation usually goes hand-in-hand with higher real interest rates, since investors require a higher risk premium. Because real economic growth is usually also lower under high-inflation conditions, the growth / interest rate differential (y – r) is more likely to shrink or turn negative under high inflation conditions which will be more likely to lead to an unsustainable fiscal situation.
|